We employ the two dimensional infrared four-wave mixing (2D IR FWM) method as a vibrational spectroscopic tool to quantify the amino acid content of a number of peptides. Vibrational features corresponding to ring modes of the aromatic group of phenylalanine (Phe) and tyrosine (Tyr) are identified, as well as a methylene mode which is used as an internal reference. We show that the ratio of the integrated intensities and amplitudes of the aromatic peaks of Phe and Tyr relative to the methylene integrated intensity and amplitudes are respectively proportional to the actual ratio of Phe and Tyr to CH2 in the samples. This demonstrates that this form of 2D IR spectroscopy has the potential to quantify the amount of a specific amino acid in peptides by measuring 2D vibrational features without undue interference from secondary structural effects.
Fournier F., Gardner E.M. & al,Anal. Biochem., 2008, Vol: 374, Pages: 358-365
Experimental results
The 2D IR FWM spectra of eight peptides studied are shown figure 1.
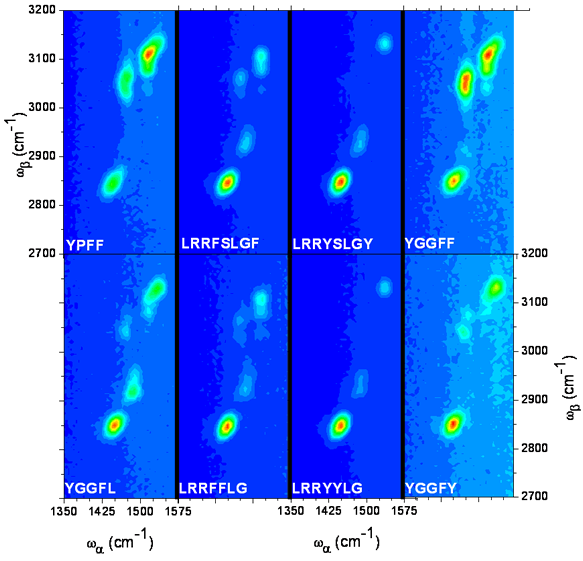
Figure 1.
The amino acid sequence for each of the samples is indicated in each spectrum; F: phenylalanine, G: glycine, L: leucine, P: proline, R: arginine, S: serine, Y: tyrosine. For all spectra the delays are t12=1.5 ps and t23=1 ps. Variations in pulse timing due to variation in optical path caused by scanning in the OPAs is compensated for by continuous adjustment of the delay lines. wa is scanned from 1350 to 1570 cm-1 and wb from 2700 to 3200 cm-1 both with a 5 cm-1 increment. The spectra are presented with the horizontal and vertical axis evenly scaled and the intensity linearly scaled; thus the peak line shapes are real. The color scales are not identical from one spectrum to another to help identify the features so the peak intensities can not be directly compared from this figure. The peak at 1450/2850 common to all the spectra is attributed to aliphatic CH2 vibrational modes, and is taken as an internal reference. The high frequency features are attributed to aromatic vibrational modes of tyrosine and phenylalanine.
By looking closely to the LRRFSLGY and LRRYSLGY spectra, specific features corresponding to phenylalanine (F) and tyrosine (Y) are clearly identified (figure 2).
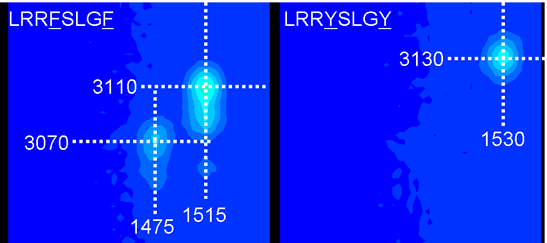
Figure 2.
These cross peaks correspond to aromatic vibrational modes of the phenylalanine and tyrosine side chains.
The peaks identification is summarized in the following figure (figure 3):
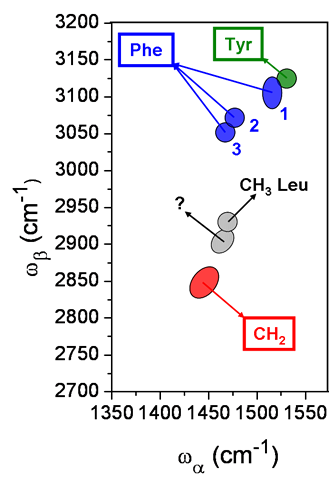
Figure 3.
A spectral feature for leucine is identified, as well as a CH2 peak which is present in all the peptide spectra and used as an internal reference for the fingerprinting. The peak at 1460/2900 was left unassigned: it could be a weak contribution from glycine. The CH2 peak at 1450/2850 is assigned to deformation CH2 / sym stetchCH2. There are two vibrational ring stretching modes contributing to the aromatic peaks: CC+HCC in-plane (n13) and CC+HCC in-plane+CCC in-plane (n16). For phenylalanine, the peak 1 has mainly two identified contributions: 1515/3110 (n13 / comb. n13 & n16) and 1515/3080 (n13 / comb. n13 & def. CH2+n16), the weaker peak at 1515/3040 being left unidentified; the peaks 2 and 3 (at 1480/3070 and 1470/3050) are attributed respectively to (def. CH2+n13 / comb. def. CH2+n13 & n16) and (def. CH2+n13 / comb. def. CH2+n13 & def. CH2+n16). The tyrosine peak at 1530/3130 is only composed of the ring stretching modes: (n13 / comb. n13 & n16).

Method of analysis
The following table shows the amino acid sequences of the eight samples studied and their total number of CH2, tyrosine and phenylalanine, as well as the number of Phe and Tyr relative to CH2.
Sequence |
NCH2 |
NY |
NF |
NY/NCH2 |
NF/NCH2 |
LRRFSLGF |
12 |
0 |
2 |
0 |
0.17 |
LRRFFLG |
11 |
0 |
2 |
0 |
0.18 |
LRRYSLGY |
12 |
2 |
0 |
0.17 |
0 |
LRRYYLG |
11 |
2 |
0 |
0.18 |
0 |
YGGFF |
5 |
1 |
2 |
0.2 |
0.4 |
YGGFY |
5 |
2 |
1 |
0.4 |
0.2 |
YGGFL |
5 |
1 |
1 |
0.2 |
0.2 |
YPFF |
3 |
1 |
2 |
0.33 |
0.66 |
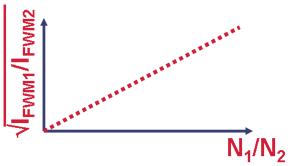
We want to verify the proportionallity of the FWM signal (IFWM) ratio to the square of the relative number of amino acid:
Two kinds of analysis are used:
- Spectra fitted with 2D coherent gaussian functions to extract the spectral parameters for each peaks (withs, amplitudes, frequencies) and calculate the integrated intensities relative to the CH2 peak integrated intensity.
An example of fit is shown on the figure 4.
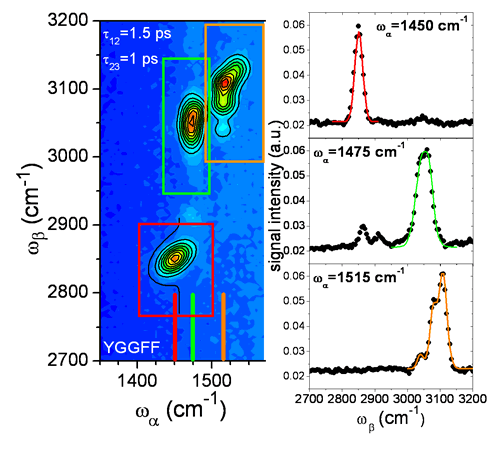
Figure 4.
The spectrum used is the one obtained for the YGGFF sample. On the two-dimensional graph, the experimental data are shown in color levels, the fits are represented by the black contours. The regions of interest used for the separated fitting procedure are shown in red, green and orange. They correspond respectively to the aliphatic region, the low frequency aromatic region and the high frequency aromatic region. Three profiles for the three spectral regions are shown at 1450 cm-1, 1475 cm-1 and 1515 cm-1: the black dots are the data points, the color lines are the fits restricted to their respective region.
- Signal level measured for each peaks with background substraction. The amplitudes relative to the CH2 peak amplitude are then easily calculated.
Results
The results of both analysis are shown in figure 5. First for three phenylalanine peaks and then for the tyrosine peak.
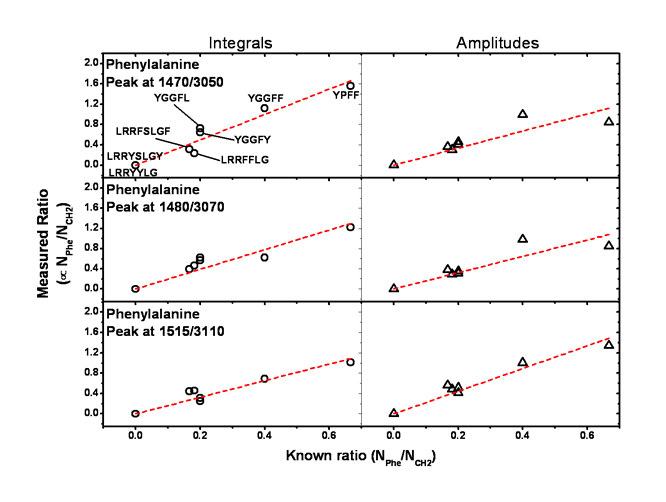
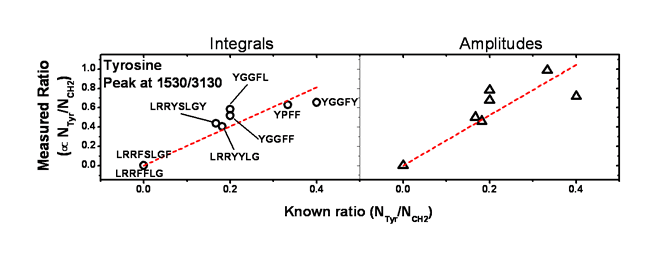
Figure 5.
The corresponding samples are shown in the first graphs for each amino acid. The dashed red lines are the linear fits constrained to go through the origin. Indeed, a sample which has no phenylalanine nor tyrosine would not show any signal at the specific frequencies.
The dispersion out of the linear behaviour is a bit more pronounced for certain peaks when plotting the ratio of the amplitudes of the peaks rather than the intagrated intensities. This comes from the fact that the integrals are calculated using the spectral parameters from the fitted spectra; each peak are then independant from each other and are interference free.
The tyrosine peak seems to show a stronger dispersion out of the linear behaviour compare to phenylalanine. This could indicate a bigger sensitivity of tyrosine to the structure and conformation of the peptides.
|

